Dashboard visualizations apply a summary function to the selected measure in order to derive the numeric values for the output.
The summary functions available for all data types are:
•Count – the number of values in the results. Null values do not increase the count.
•Count Distinct – the number of distinct values in the results. Duplicate values do not increase the count.
•Max – the largest value in the results, either numerically or alphabetically
•Min – the smallest value in the results, either numerically or alphabetically
The summary functions that are available only for numeric data types are:
•Sum – the sum of all values in the results
•Average – the average of all values in the results
•StdDev – the estimated standard deviation of a population, with the assumption that the included values cover only a sample of a larger population
•StdDevP – the standard deviation of a population, with the assumption that the included values cover the entire population
•Var – the statistical variance of a population, with the assumption that the included values cover only a sample of the larger population
•VarP – the statistical variance of a population, with the assumption that the included values cover the entire population
By default, data items calculate a sum for numeric measures and a count for measures that contain another type of data.
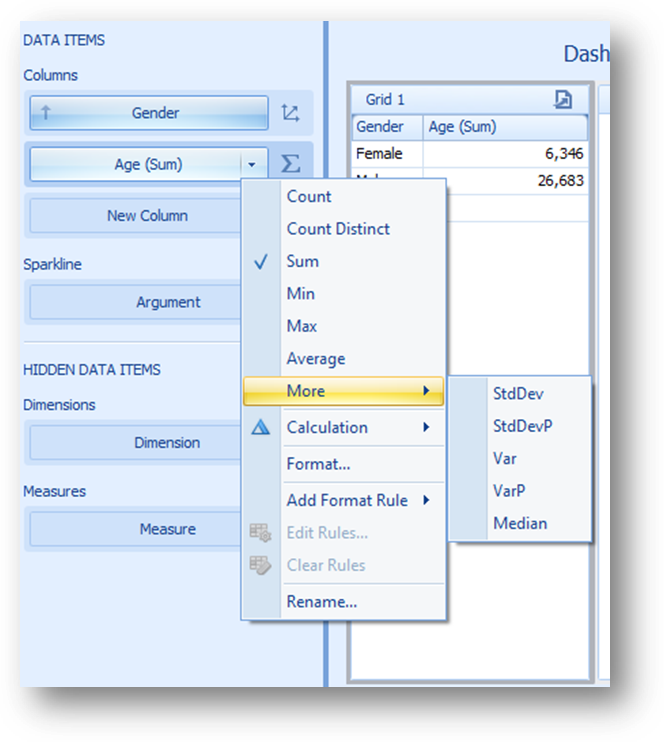
You can change the summary function type to any of the available types. Click the drop-down arrow in the right-hand edge of the data item box and select the desired summary type. Less common summary types are organized in the “More” submenu.