Purpose: To display information pertinent to the file maintenance tab, routine, or view.
Example: The data in the grid can be manipulated in various ways. The grids allow you to move columns, sort the values of any column, and view subsets of data.

You can change the order of the columns in a grid. Click on the column header and drag it to the new position. When you release the mouse button the column will move.

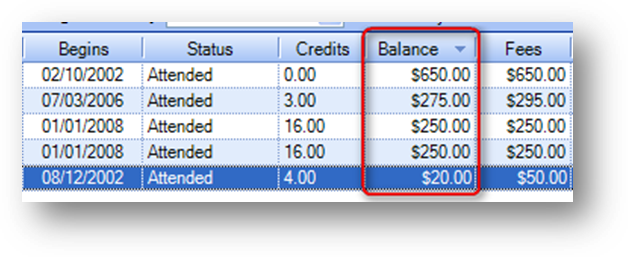
The grids also allow you to sort the data in any column. Click the column header of the column you want to use to sort by. The information in the grid will be sorted based on the selected column’s values. To add additional fields to the sort hold down the Shift key and click another column. The information in the grid will then be sorted based on the first column clicked and then the second column.
Note: An arrow appears to reflect whether the sorted values are in ascending or descending order. You can toggle between ascending and descending order by repeatedly clicking the column header.
Note: Where enabled, changes made to the grid such as moving a field, changing the width of a column, or the sort, are saved under the current login account. These settings will remain for the grid and login account until the user resets to the system defaults. To go back to the system default settings for a grid, right click anywhere in the grid to open the context menu and select Reset Columns.

When a grid is displaying both summary and detail information it is set up with what we call “parent” and “child” or “detail” rows. The summary information is shown in the “parent” row and the detail information is shown in the “child” row(s). To view the detail or “child” row(s) in a grid, click on the plus sign to the left of the “parent” row.

As an example, in the Dues Journal Transactions grid on the Dues tab in Names file maintenance, the “parent” row shows a summary for each dues year. The detail rows are the individual journal transactions for that dues year.

The detail or “child” rows may also be displayed in groups. In the Product Details grid on the Products tab in Names or Firms file maintenance, there are three sub groups of detail information. The information in each of these groups varies, so they are shown separately. The Line Items on Order grid shows the line items on the product sale while the Invoice on Order grid shows the invoice information for the entire product sale. The Payments on Order grid shows any payment transactions for the product sale.

Some grids also have a filter row at the top of the grid. This allows you to do additional filtering on any field in the grid.
Once there is data populated in the grid there are two ways of using the filter rows to filter the display of the data in the grid.
The first is to type text in a field. This will filter the display of the data in the grid to show only those records that start with the text that was entered. In the example above, “105” was typed in the Item Code field. This will further limit the records that were originally displayed in the grid, to only those that start with “105”.

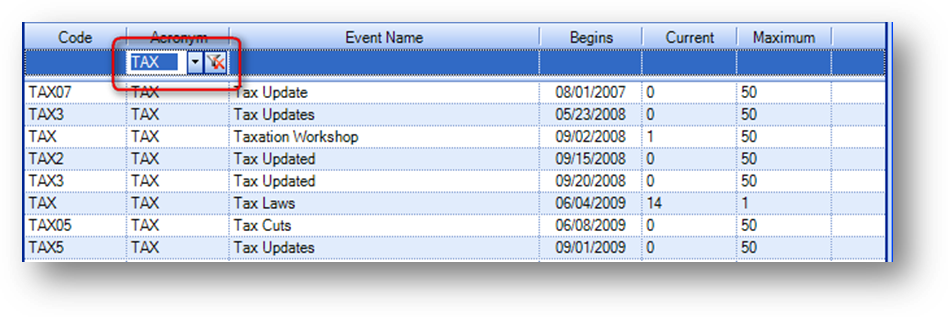
The second way is to select a value from the drop-down list. The drop-down list in a field is pre-filled with the unique values from the records being displayed in that column. In the example above, “TAX” was selected from the Acronym drop-down list. This will further limit the records that were originally displayed in the grid, to only those that have an acronym of “TAX”.
To clear the display filter click the remove filter icon in the right of the field in the filter row.

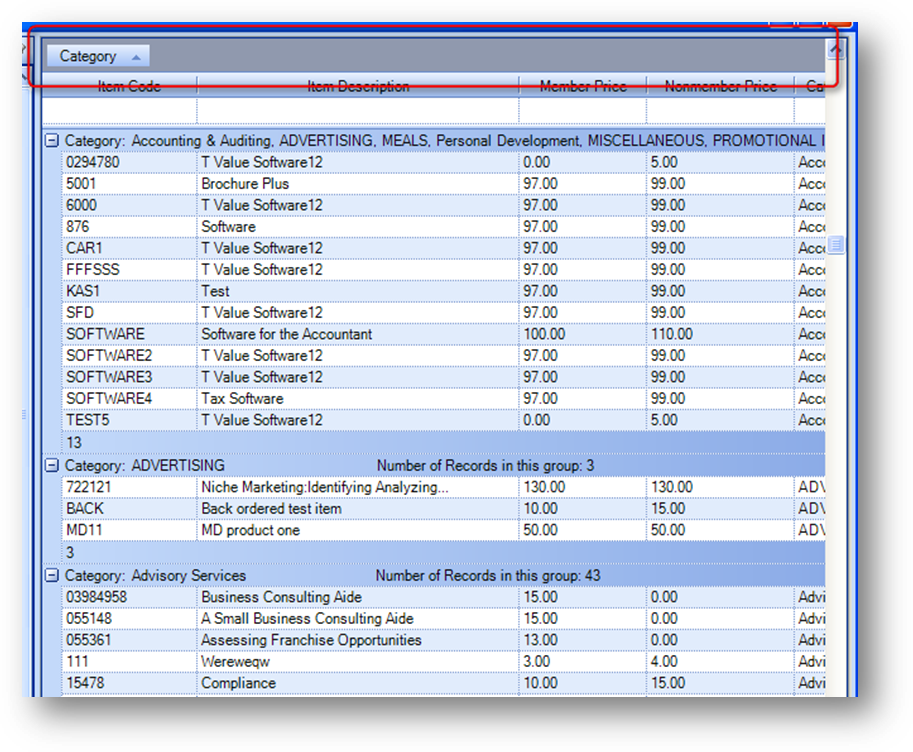
A grid can also have a grouping area above the grid. This allows you to group the data currently displayed in the grid.

In the example above, the header on the Category field was dragged into the grouping area. The data is then grouped by category in the grid. To remove the grouping, drag the field out of the grouping area.


You can drag multiple fields into the grouping area. In this example, the data is first grouped by category, and then sub-grouped by member price.
Watch the Grids training video: